Forward Prediction Without Calibration: SynaCore AM-DT Benchmark for Thin-Wall Structure Distortion
Thin wall structures are very common in manufacturing – think of turbine blades, heat exchangers, and microsatellites, for example. Yet, manufacturing these components using metal additive manufacturing is extremely challenging, due to the significant distortion that they exhibit during printing.
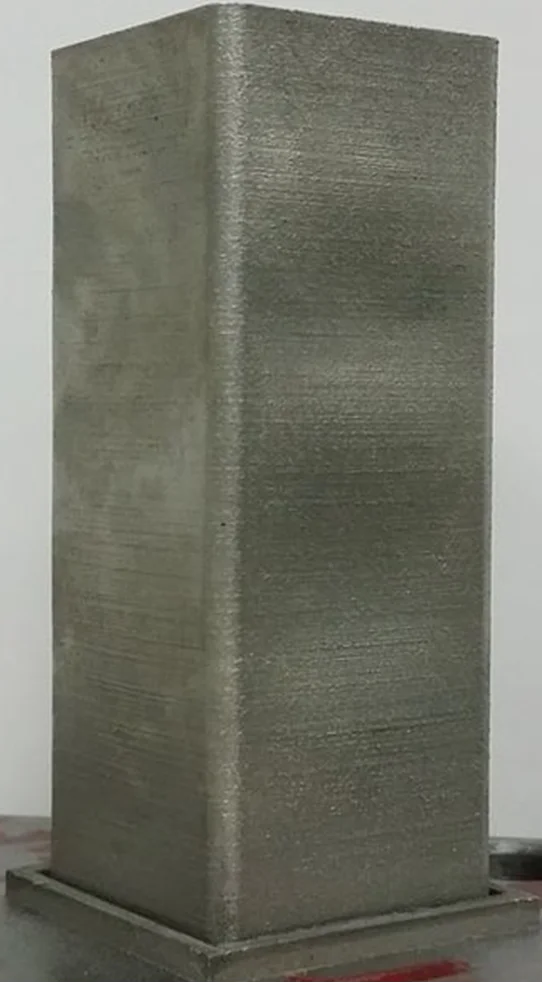
At SynaCore, we have developed advanced capabilities in this area which enable you to predict, and correct, distortion in thin-wall structures. To demonstrate this predictive capability, we publish here a very challenging benchmark. This benchmark is a square tube thin-wall structure, 80mm tall, 30mm wide, with very small wall thickness: 500um. The part is shown in Fig. 1.
The layer-by-layer build was simulated using our AM-DT version 2.7.0. Mesh size was 0.5mm. Simulation wall clock time was ~15 minutes using 16 cores AMD EPYC 7642. Importantly, no attempt for calibration was done; in other words, this was a forward prediction, without any fitting parameter involved. The animation of the build is shown in Fig. 2.
From this figure we can observe important features of how the part is deforming during printing. First, we notice that at the initial layers, the deformation is symmetrical is all four walls: they are all bending outwards. However, at about 30mm height, a buckling instability occurs whereby the distortion pattern develops into a pair-opposing mode, with two walls bending outwards and the two others bending inwards. Capturing such transition with consistent numerical convergence is challenging, yet we have made it seamless for the user to achieve this in our AM-DT.
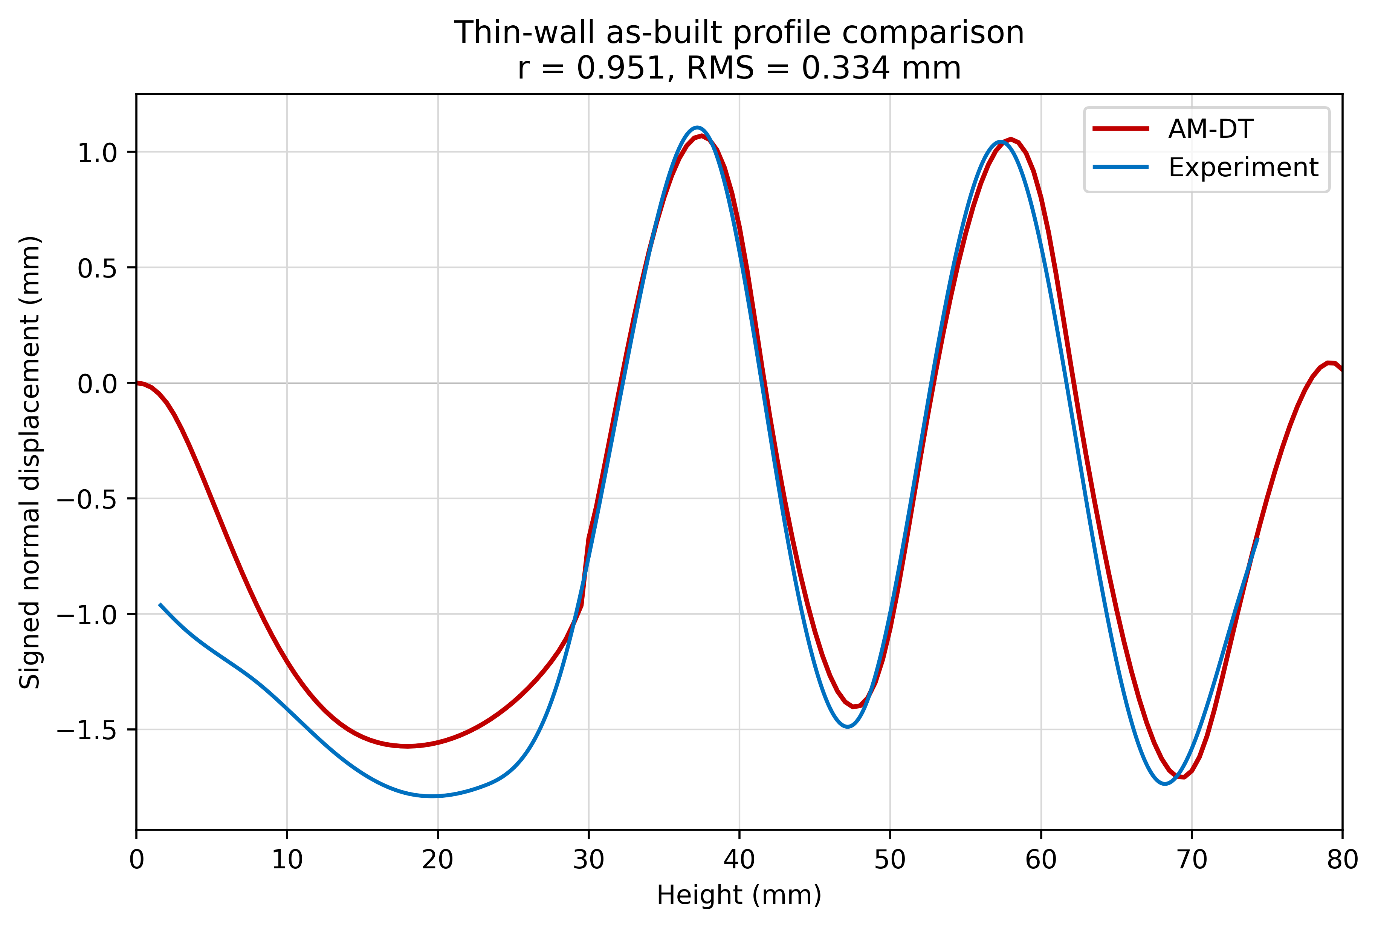
The agreement with the experimental quantitative measurement of distortion is excellent, as shown in Fig. 3. Of particular importance, the number of inward/outward lobes is captured correctly, as well as the quantitative excursion of out-of-plane distortion. A somewhat coarser match it seen towards the base of the wall, which we ascribe to difficulties in measuring distortion in regions close to the baseplate (this was as-print conditions, before baseplate removal). Overall, the root mean square error (RMS) was an impressive 0.334mm.